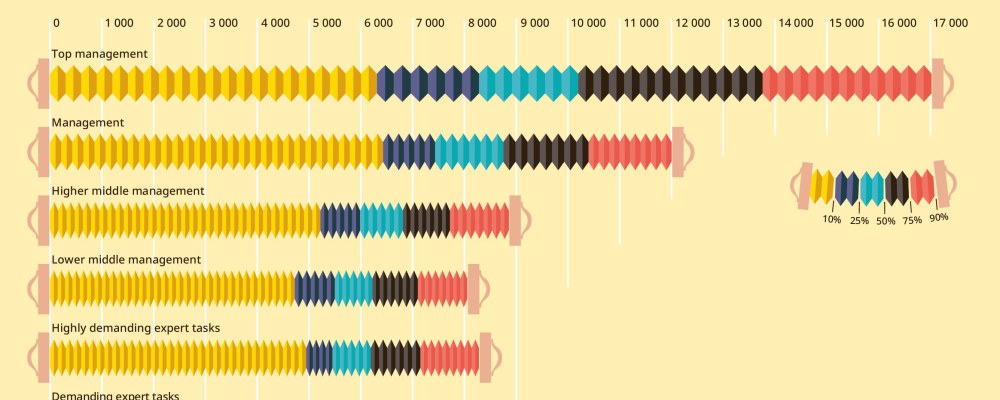
According to a labour market survey conducted by Academic Engineers and Architects in Finland TEK, salary ranges are widest in senior management positions. Last year, the median salary for senior managers was EUR 10,200 per month; however 10 per cent of respondents in these roles earned less than EUR 6,307 per month, while the top 10 per cent earned more than EUR 17,020 per month.
Although discussions about salaries often focus on median and average figures, it is important to acknowledge the substantial salary spread that exists even among roles of similar seniority.
Pay dispersion is significantly lower in demanding specialist roles, the most common job category among TEK’s members. Job categories in TEK surveys describe general levels of responsibility and respondents’ positions are self-reported according to these categories.
Specialist roles differ from managerial roles in that they do not involve supervisory responsibilities. Demanding specialist roles are independent roles that include job titles such as development engineer, researcher, designer and software engineer.
Highly demanding specialist roles come with even greater responsibility and include job titles such as project manager, development manager, senior specialist and chief specialist.
The median salary for demanding specialist roles was EUR 5,125 per month. Among respondents working in such roles,10 per cent earned less than EUR 4,020 per month, while the top 10 per cent earned more than EUR 6,856 per month.
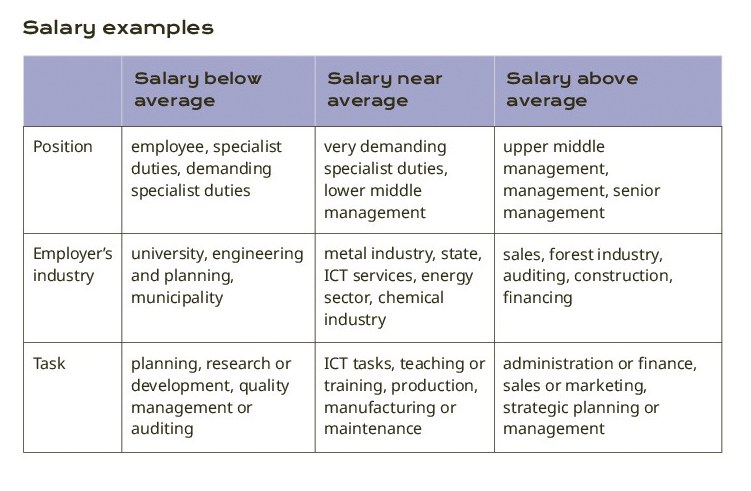
There are many reasons for pay dispersion: it may be related to the employer, based on the industry, company size or location; the specific role, based on the tasks, objectives and responsibilities entailed; or the employee, based on their experience, skills and performance.
The accompanying table provides examples of roles based on their deviation from the median salary.
TEK once again negotiated better salaries for its members
In 2025, the median salary for employees with a Master of Science in Technology (diplomi-insinööri) rose by 3.2 per cent from the previous year, and their purchasing power has grown over the year.
Purchasing power is a measure of the quantity of goods and services that a person can purchase with their income.
Graduates with a Master of Science in Technology also saw an increase in their purchasing power in 2024, but real-terms salaries fell in both 2023 and 2022.
”Despite how it may seem, there is no such thing as automatic pay progression. In reality, TEK has to bargain with employer unions on behalf of its members to ensure that collective agreements provide annual pay increases. The collective bargaining we do represents real value for money and unbeatable customer service for our members,” says Labour Market Director Teemu Hankamäki from Academic Engineers and Architects in Finland TEK.
”Regular pay increases more than make up for the cost of union membership, and there would be essentially no pay progression without the bargaining efforts of trade unions such as TEK. We naturally also have members who qualify for merit increases, salary raises initiated by an employer unrelated to collective agreements, but merit increases are actually relatively rare in practice.”
Increasing members’ purchasing power is always at the top of the agenda during salary negotiations, according to Hankamäki.
It appears that this year’s salary increases will finally give TEK’s members a proper boost in terms of purchasing power.
”The collective agreements negotiated by TEK secured total increases of approximately 2.5 per cent for our members last year. With the 12-month change in the consumer price index, or annual inflation, at just 0.2 per cent, it is clear that our members’ purchasing power has grown. Inflation is forecast to remain about 1.5 per cent this year, which, combined with collective agreements delivering pay increases of 2.9 per cent, promises to bring a rapid rise in purchasing power in 2026,” Hankamäki explains.
Hankamäki wants people to remember that the recovery of purchasing power appears to be boosting the national economy as a whole and that recent pay increases are not expected to result in a self-perpetuating cycle of inflation and accelerating price increases.
”Everyone, including those who were outraged and vehemently opposed to contractual increases last spring, is now counting on these signs of recovery in the Finnish economy.”
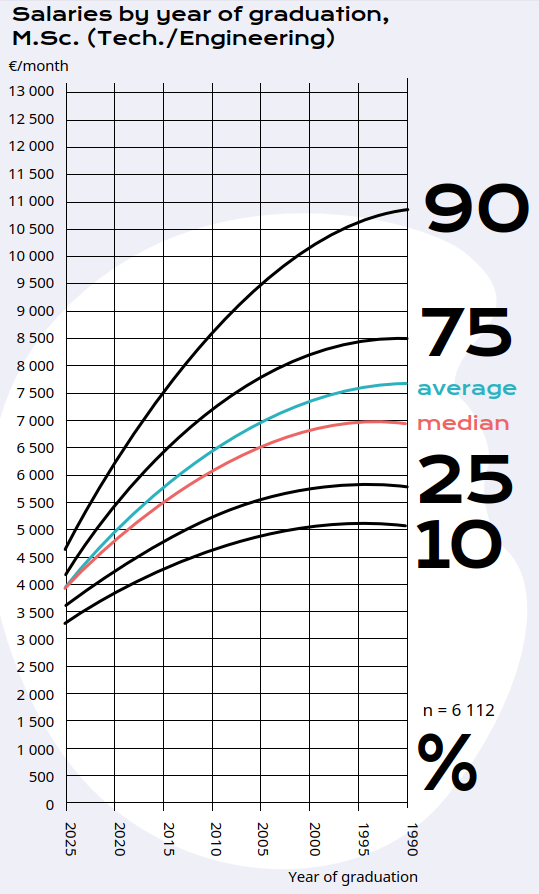
The median monthly salary for employees with an MSc in Technology rose to EUR 5,915
The labour market survey shows that permanent employees holding a Master of Science in Technology had a median salary of EUR 5,915 and an average salary of EUR 6,368 per month in October 2025. The corresponding salary figures for those who graduated with a Master of Science in Technology in 2025 were EUR 4,000 and EUR 4,193 respectively.
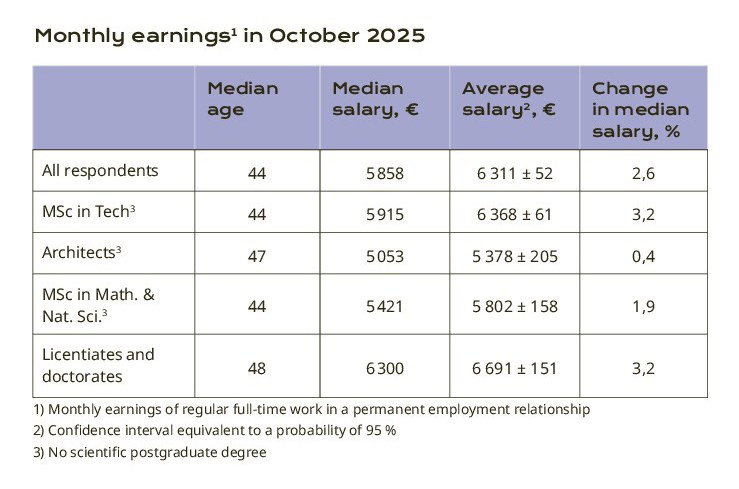
Salary development was also positive in other degree groups.
This year, the largest increases in median salaries were for graduates with a Master of Science in Technology and those with doctoral degrees.
Results are less reliable for groups with small numbers of respondents and annual fluctuations in either direction are not uncommon.
Most pay rises are general increases negotiated by TEK
Of respondents who were employed on a full-time basis, 83 per cent reported that their salary had increased since the previous year. In total, 10 per cent said that their salary had remained unchanged and 3 per cent reported a drop in their salary. The proportion of those who reported a pay rise was slightly higher than in the previous year, when eight out of ten respondents reported an increase.
General increases, also known as across-the-board raises were by far the most common type of pay rise. Of respondents whose salary had increased, 77 per cent reported that their pay rise was based on a flat general increase provided for in a collective agreement. A total of 17 per cent of respondents who had received a pay rise said that their raise had been initiated by their employer based on an applicable collective agreement.
A total of 19 per cent of respondents whose salary had increased had received a so-called merit increase based on personal performance.
This proportion was slightly lower than the 22 per cent from the previous year. Among respondents who reported receiving a pay rise, 10 per cent reported that it was due to taking on a new role with the same employer, while 7 per cent reported it being due to a change in employer.
Largest salary increases for those who changed employers
Those who received a merit increase saw their monthly salary rise by an average of EUR 300 (median increase). A new position or role with the same employer resulted in an average monthly increase of EUR 540, while a move to a new employer brought an average increase of EUR 800 per month. Changes in jobs were rewarded more generously than the previous year, when the median monthly increase was EUR 700.
Salaries increased by approximately 2.5 per cent in many industries in 2025; some of these increases were general increases while others were employer initiated. The way in which the issue of pay is dealt with varies from sector to sector, and there are also local agreements. On average, general increases increased monthly salaries by EUR 151.
Slightly over half of respondents were on a performance-related salary
Of respondents who were employed on a full-time basis, 53 per cent said their salary was linked to their performance. Performance-related pay schemes are most common in industry, where more than 70 per cent of respondents were employed under such contracts.
With regard to position, performance-related pay is more common in managerial than specialist roles. Of those working in executive positions, 68 per cent reported that their pay was performance based, with the respective figures being 64 per cent for those in middle management positions and 48 per cent for those in specialist roles.
Of those covered by a performance-related pay scheme, 80 per cent had received a performance bonus within the past 12 months, the same proportion as in the 2024 labour market survey.
The median level of performance bonuses also remained unchanged from the previous year, at 8 per cent of annual earnings. The median bonus for executives was 12 per cent; the median bonus for those in middle management and specialist positions was 9 and 7 per cent respectively. Bonuses for executives and middle management have increased slightly from 2024, while for specialists they have remained unchanged.
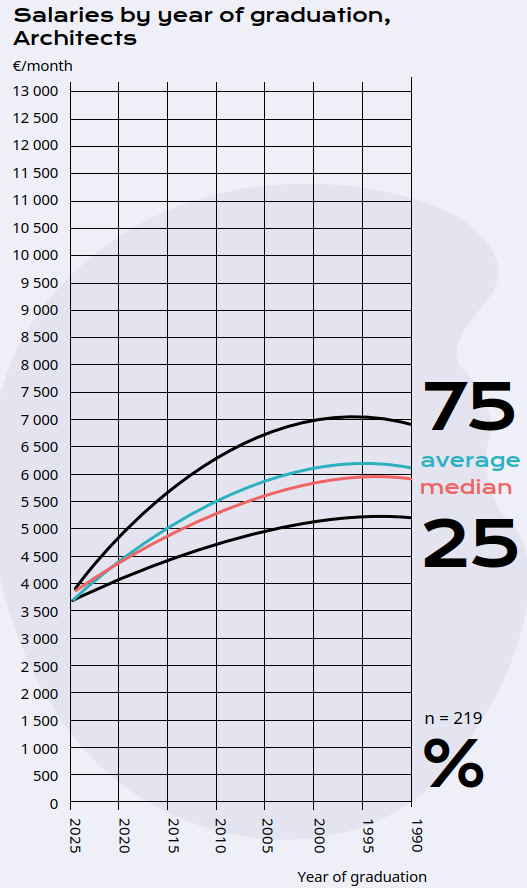
Salary graph markings in the figures below
n = number of respondents
10 % fractile = a salary of which 10 % of respondents earn less.
25 % fractile = a salary of which 25 % of respondents earn less.
Median = the middle point of all salaries in order of magnitude. There is an equal number of salaries above and below the median.
75 % fractile = a salary of which 25 % of respondents earn more.
90 % fractile = a salary of which 10 % of respondents earn more.
The salary concept used in the Labour Market Survey is total gross monthly earnings. It includes the basic salary, the taxable value of fringe benefits (e.g. phone benefit of €20/month) and monthly payments such as sales commissions. It does not include overtime pay, holiday bonuses, annual bonuses or performance bonuses that are paid less frequently or over a period of more than one month.
The salary graphs include salaries from both permanent and fixed-term employment relationships. The graduation year refers to the year of completion for those with a postgraduate degree, but for those with a graduate degree (MSc, architect) it refers to the year of graduation.
This is how the survey was conducted, thanks to you!
Data collection for the labour market survey was carried out in October–November 2025, and the target group consisted of TEK members in the labour market. We received approximately 9,300 responses, and the response rate was about 20 percent.
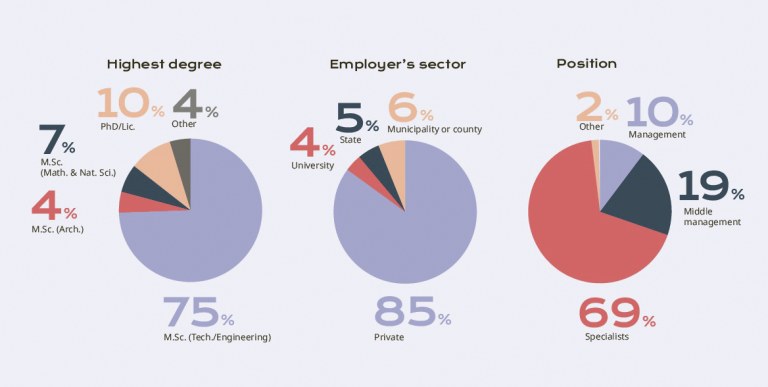
Of the respondents, 73 percent were men and 27 percent women. The median age was 44 years. The most common degree completed was that of a Master of Science in Engineering which was held by 75 percent of respondents. The vast majority of respondents, 86 percent, were employed full-time. 5.5 percent of respondents were unemployed or laid off and 1.4 percent were full-time entrepreneurs. The percentage of respondents who were unemployed or laid off was higher than in the previous year, when it was 4.6 percent.
Of the respondents working full-time, 85 percent worked in the private sector, and about half of them worked in industry. 95 percent of respondents were employed on a permanent basis.
A warm thank you once again to everyone who participated in the survey! We gain valuable insights from the labour market survey to support TEK’s member services, advocacy work and influence efforts.