
Across Finnish universities awarding degrees in engineering/technology, student guilds play an essential part in onboarding new students and carrying on the teekkari culture. But how inclusive are these communities, and how well do they match the expectations of the increasingly diverse student population?
The TEK Student Survey, conducted every September, gathers data on student members’ wellbeing, employment, and attitudes toward working life. In 2025, the survey obtained the views of 3,715 students of engineering/technology, architecture, IT/ICT, and natural sciences.
The TEK Student Survey covers also annually varying themes. In the latest survey, one main topic was guild culture. This article focuses on these results, depicting participation, belonging, and experiences of inappropriate conduct within guilds and degree associations. Besides shedding light on the students’ views in general, it highlights the differences by respondents’ gender (man/women/other) and language group (Finnish/Swedish/English).
In the following, ‘guild’ refers both to guilds and degree associations, but we are mainly using ‘guild’ for shortness and convenience.
Participation: Remarkable language group differences
Engish-speaking respondents do not feel they can influence the student culture - at any level - in the way they would like. Among English speakers, up to 35-44 per cent disagree with the statements presented in Figure 1. This contrasts particularly with Finnish-speaking respondents at the guild level, as majority of Finnish speakers report they can impact the student culture in the guilds the way they want to.
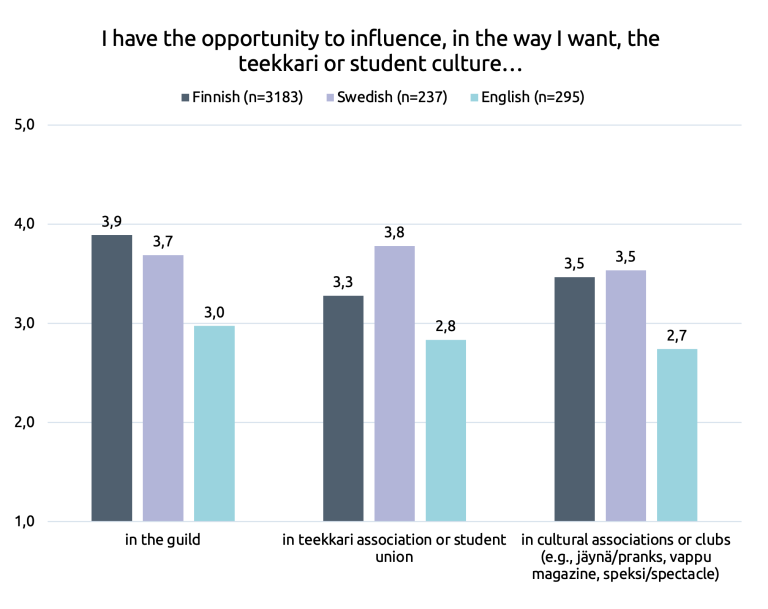
Moreover, while guilds remain central to student culture, participation varies significantly across language groups. 24 per cent of all respondents have been part of a guild board or held an official position, but the corresponding figure is only 13 per cent for English speakers. On the other hand, 22 per cent of all respondents have never taken part in guild activities, but this mainly reflects the situation for Finnish and Swedish-speaking respondents. Among English speakers, up to 36 per cent have never involved in guild activities.
Therefore, the results point to a language barrier hindering the opportunities of English-speaking students to contribute and engage in guild activities. However, influencing at higher level such as teekkari association or student union, or in cultural associations or clubs, seems even more challenging.
Interestingly, women and non-binary respondents are more likely than men to act as guild board members of officials. Among men, 21 per cent reported they are or have been in such roles whereas the corresponding figures for women and non-binary respondents are 27% and 38%, respectively. On the other hand, all genders (men, women, and others) agree that they can best influence the culture at the guild level.
Belonging in guild culture: Strong but some variation
Students* perceive the culture of their guild mostly in a positive light. We were delighted to find that over 80 per cent of respondents agree they feel accepted, can be themselves, and perceive the guild atmosphere as good (see Figure 2). Furthermore, the guilds are seen to offer a variety of events, and all willing guild members can participate in organizing them. Only 5 per cent of all respondents disagree with these statements, reflecting general satisfaction with the guild culture.
Compared to a previous survey conducted in 2018, the culture in the guilds appears to have improved. For example, the atmosphere was considered good by 70% in 2018 while the corresponding figure is now 81.
* Please note that the results reflect the views of students who have participated in guild activities at least occasionally, comprising 61 per cent (=2,266) of total respondents.

Nonetheless, some issues still may require improvement. Although over half of the students (59%) report that alcohol consumption does not have an overly central role in the guild’s culture, 15 per cent disagree. Even more divided are views on whether working during studies is an obstacle to participating in the guild’s activities: 36% think that working does not hinder participation whereas 22% disagree.
The three belonging statements - feeling accepted, being able to be oneself, and thinking that the guild atmosphere is good (see Figure 2) - were further analysed by gender and language group.
Pertaining to gender, the findings provided a delightful surprise: students feel accepted in their guilds regardless of gender. While men reported the most positive views, majority of women and non-binary respondents also agreed with the statements. All means reach 4.0 or more on a scale of 1 to 5 (see Figure 3), suggesting overall agreement. Yet the largest difference (0.4) is between men and non-binary respondents regarding the statement “I feel I can be myself in the guild community”, indicating that non-binary respondents feel less fully than men that they can be themselves.
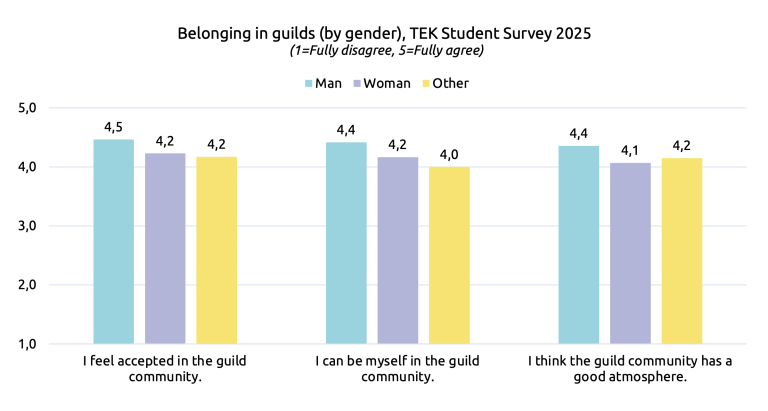
Why were we surprised by these results? Because prior studies have shown that gender has a strong impact on sense of belonging. Most notably, men tend to be convinced that also others see them as belonging in the field of technology in general whereas women are less certain, and non-binary respondents even more so. Moreover, while men and women both experience belonging in their study community, non-binary respondents feel less accepted.
Hence, the latest findings suggest that the closest community, the guild, is experienced as more welcoming by women and gender minorities than the wider study community, or the field of technology overall.
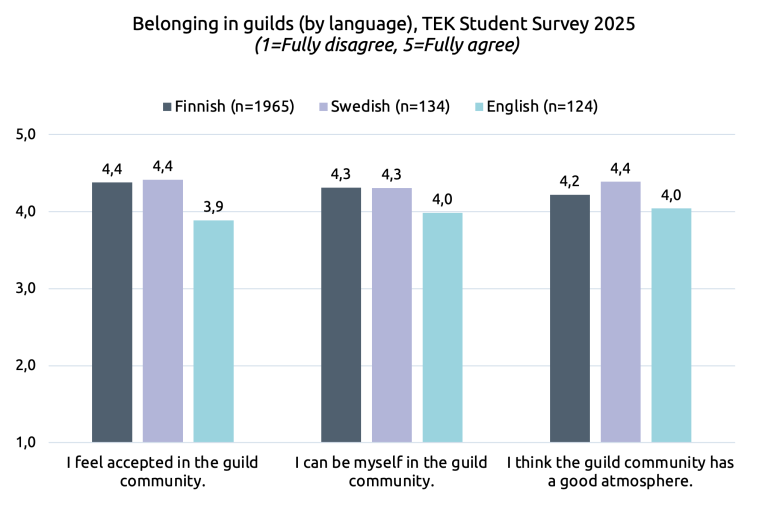
While the results are generally positive among the three language groups, the English speakers, nevertheless, differ clearly from the others. In particular, the difference between Finnish-speaking and English-speaking respondents is remarkable (0.5) pertaining to feeling accepted in the guild community (see Figure 4). Albeit the percentage share of disagreeing respondents is moderate (around 10% per statement), it is over double that of Finnish or Swedish speakers.
Inappropriate behaviour: Considerable gender differences
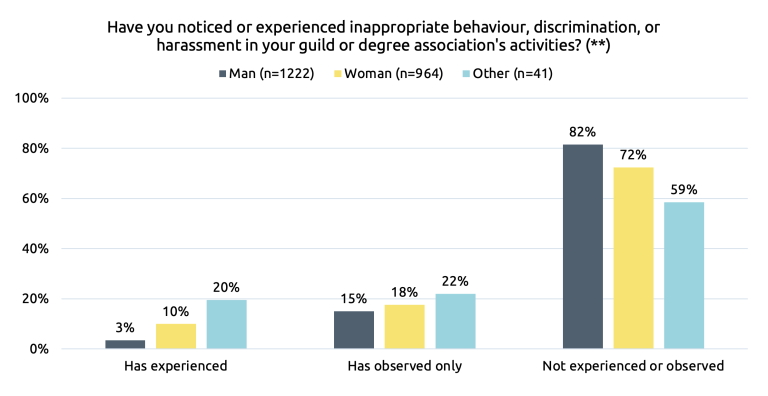
The respondents were also asked about experiences and/or observations of inappropriate behaviour, discrimination, and harassment. The findings reveal considerable gender differences: Women (10%) and non-binary respondents (20%) report far higher rates of experiencing inappropriate conduct than men (3%). (See Figure 5.)
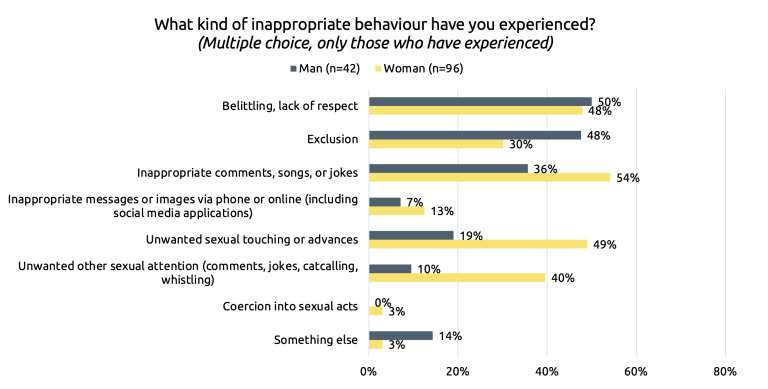
Moreover, the inappropriate conduct encountered by men and women is somewhat different (see Figure 6). Women far more often have faced harassment of sexual nature whereas men report experiencing exclusion more often than women. Please note that the experiences of non-binary respondents are not reported due to the small number of respondents (8 persons).
On the other hand, the differences between language groups were moderate. While English-speaking respondents had personally encountered inappropriate behaviour more often (10%) than Finnish-speaking respondents (7%), they had observed it less often, and thus the percentage shares of not experiencing nor observing were the same (77%).
A positive finding was that the majority, approximately 90%, say they know who to contact if harassment occurs. However, English-speakers seem less aware of the practices, since 20% said they do not know who to contact. Moreover, 14% of those who had encountered inappropriate conduct reported they do not know who to contact. Hence, the guilds may need to check that the information reaches the whole student body.
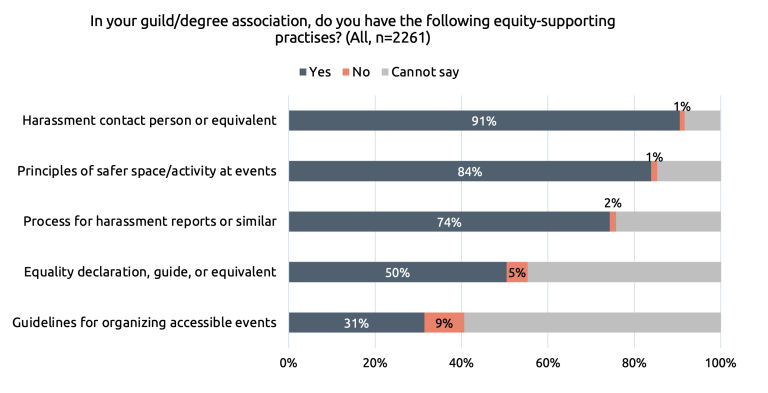
Continuing with the positive findings, the guilds clearly have deployed practices supporting equity (see Figure 7). Up to 91% of respondents say their guild has that a harassment contact person, 84% report that the guild has safer space principles at events, and 74% confirm there is a harassment reporting process. Half of the respondents also report that the guild has an equality declaration or similar guidelines.
The path forward?
The findings, while positive overall, also highlight some of the remaining challenges in inclusion in the guilds. The differing views and experiences of English-speakers and non-binary students stress the importance of proactive DEIB work (diversity, equity, inclusion, belonging) to ensure that all students can fully participate in their closest student community.
TEK has been supporting guilds on this journey and continues to do so. This survey is one example. By identifying both strengths and issues requiring improvement, we hope to help guild officials and other actors to further improve their activities and practices.
Check out more results from a visualization! The visualisation is available for TEK members.
TEK Student Survey 2025: Views of LGBTQIA+ students on guild culture
What study?
- TEK Student Survey provides information on student members’ wellbeing, employment during studies, and attitudes toward working life. The results are also used to determine TEK’s salary recommendations for internships or summer jobs, and master’s theses.
- The survey is conducted annually in September. In 2025, data collection took place 17–30 September.
- A link to the anonymous online survey was sent to all TEK’s student members (excluding first-year students), N = 23,231. A total of 3,715 students responded, and the response rate was 16%.
- Respondents represent all universities offering studies in engineering/technology, ICT, or natural sciences in Finland. The largest respondent groups came from Aalto University, Tampere University, and LUT University. See Table 1 for details.
- Women were slightly overrepresented, but it was not deemed necessary to weigh the data by gender.
| Respondents (n) | (%) | |
| Aalto University | 1 093 | 29,4 |
| Helsinki University | 143 | 3,8 |
| University of Eastern Finland | 65 | 1,7 |
| University of Jyväskylä | 102 | 2,7 |
| LUT University | 441 | 11,9 |
| Oulu University | 404 | 10,9 |
| Tampere University | 959 | 25,8 |
| Turku University | 279 | 7,5 |
| Vaasa University | 109 | 2,9 |
| Respondents (n) | (%) | |
| Åbo Akademi | 103 | 2,8 |
| Other | 17 | 0,5 |
| Total | 3 715 | 100 % |
Table 1. Respondents by university.